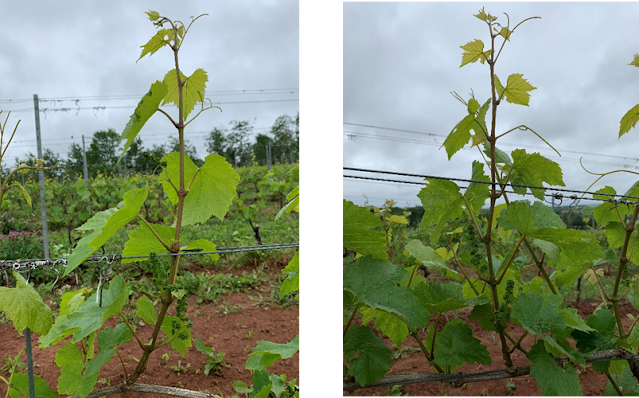
Jeff Franklin, from AAFC Kentville, is without any doubts the best weather contributor bringing every week updates to understand how the growing season progresses and the comparison with previous years. Last week brought an important amount of rain and the temperatures decreased, which impacted vineyard activities. Despite that, the season has similarities with the previous one, 2021, in terms of phenological stages. Early Hybrids, such as Baco noir or Frontenac are starting bloom this week, depending on the area it might be possible to see this since the end of last week. While others, like Geisenheim or L’Acadie blanc are slightly behind and they might be starting at the end of this week or beginning of the next, again, it might depend on the area as well. On the other hand, vinifera varieties are still behind the hybrids, and they can start bloom at the end of next week or the beginning of the following one.
The first table shows the temperature base 5⁰ C and 10⁰ C from 2019 until 2022 accumulated from March 1 until June 20. At the
end of each section, it’s possible to see the average of the last 5 and 10
years respectively.
|
Category |
2019 |
2020 |
2021 |
2022 |
5 year average |
10 year average |
|
Plant development
(Base 5ºC) |
441.0 |
473.3 |
588.3 |
548.2 |
506.5 |
513.0 |
|
Insect development
(Base 10º) |
181.8 |
231.0 |
290.4 |
255.5 |
238.8 |
242.0 |
Figure 1. Degree day accumulations as of June 20, 2022. All data are taken from the Kentville weather
station, based on a start date of March 1, and calculated using the single sine
method.
The same positive trend continues showing higher values than
the average of the last 5 and 10 years, this time slightly slower compared the
previous weeks. Like last week, 2022 is slightly lower than 2021 base 10⁰ C, with 255.5 and 290.4 base 10⁰ C respectively. These temperatures are
helping positively the grapevines, both for hybrids and vinifera, which are
starting bloom at similar time to last year.
In the following
column graph, you can see the values from 2004 until 2021 and at the end the
average of the last 5 and 10 years respectively.
Figure 2. Degree day accumulations as of June 20, 2022
base 10⁰ C. All data are taken from the
Kentville weather station, based on a start date of March 1, and calculated
using the single sine method.
The graph shows an increase of temperature in 2022, with
higher temperatures than the average of the last 5 and 10 years, even though showing
less differences than the previous weeks. Similar pattern as last week, as mentioned
before in 2021, the temperatures were slightly higher than this year until June
20. Now 2022 is slightly lower than 2017, while 2012 and 2021 are the warmest
year in this graph.
Already mentioned last week and always good idea to remind, with the high precipitations last weekend, in some places more than 20 mm of rain in less than 1 hour, the conditions present higher humidity levels and warmer conditions, which can increase fungal diseases, for example Downy Mildew, in the vineyard.
- Remember to scout the most vulnerable varieties in locations with lower air flow, more humidity, warmer conditions, and the areas where in previous years the diseases have been found.
- Spraying might be necessary in some of the products applied, as contact ones might be washed depending on the amount of precipitation received in the area. Therefore, look at the date of your last application before you decide to move forward.
- Remember to rotate products with the same group to avoid creating disease resistance, pay attention with the re-entry time and keep an eye on the forecast, especially precipitation.
In terms of plant phenology, bloom will start quite soon,
and this means the right time for the first tissue sample of the season.
- How to proceed with this? Please, look to the following video and fact sheet Grape Tissue Sampling to have more information on how to proceed.
- What are the role of the nutrients? You can read a section at the Grape Production guide to get insights about nutrients in grapevines. Please start from page 33, starting with the Grape Tissue Sampling process.
Figure 3. Frontenac plant on the left and its cluster
on the right.
Figure 4. L’Acadie plant on the left and its cluster on
the right.
Figure 5. Geisenheim plant on the left and its
cluster on the right.
Figure 6. Chardonnay on the left and Pinot noir on the right.


